|
|||||||||||||||||||||||||||
| HOMEOWNERS' EQUITY EXPANDING By Jing Fu The Financial Accounts of the United States for the fourth quarter of 2017 were released by the Board of Governors of the Federal Reserve System recently. In the fourth quarter of 2017, the aggregate market value of households' real estate continued to improve upon a nominal and not seasonally adjusted basis. On a nominal and not seasonally adjusted basis, households' owner-occupied real estate increased to $24.5 trillion total by the end of 2017, $443 billion more than the third quarter of 2017 and $1,535 billion more than the fourth quarter of 2016. Total home mortgage debt outstanding was $10.1 trillion on a not seasonally adjusted basis, $291 billion more than the same period of 2016. The value of owners' equity in real estate, the difference between the value of owner-occupied real estate and home mortgage debt, rose $1.2 trillion in the past four quarters and reached $14.4 trillion in the fourth quarter of 2017. 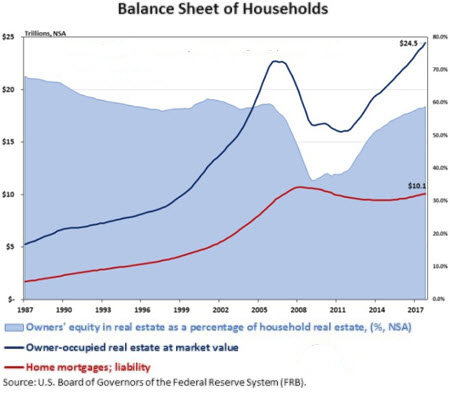 Figure 1 The blue line and the red line in Figure 1 represents the changes in the aggregate market value of households' real estate and aggregate mortgage debt; the light blue area presents the change in the ratio of owners' equity in real estate as a percentage of household real estate from 1987 to the present. The owners' equity share of home values increased to 58.8% in the fourth quarter of 2017, from 58.4% in the third quarter of 2017. Both home price appreciation and the slower increase in home mortgage debt have contributed to the increase in homeowners' equity. As shown in Figure 1, since 2012, the aggregate market value of households' real estate grew by 8.2 trillion and the underlying home mortgage debt remained relatively flat with a 0.4 trillion increase. As a result, the gap between the value of owner-occupied real estate (blue line) and home mortgage debt (red line) has widened and the majority of the increase in home values has filtered to an expansion in homeowners' equity. Based on previous analysis, even though home mortgages were still the largest share of total household loans after the recent recession, the share of home mortgages declined. Meanwhile, the share of consumer credit loans has risen. The declining share of home mortgages partly reflects the relatively flat level in the outstanding amount of mortgage debt in the recent years. 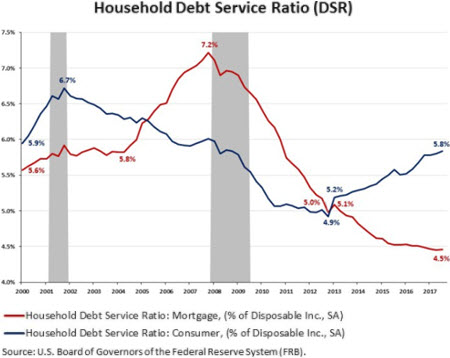 Figure 2 While mortgage debt outstanding has been flat since 2012, when taken as a share of disposable personal income, mortgage payments have been declining. Reported by the Federal Reserve Board, the Mortgage Debt Service Ratio tracks the ratio of mortgage debt payments to disposable personal income; the Consumer Debt Service Ratio tracks the ratio of consumer debt payments to disposable personal income. As previously analyzed, the Mortgage DSR and the Consumer DSR intersected twice between 2000 and 2017. More recently, the Consumer DSR has run counter to the Mortgage DSR. As the Consumer DSR rose from 5.2% in the first quarter of 2013 to 5.8% by the third quarter of 2017, the Mortgage DSR slipped from 5.1% to 4.5%, but has been falling since 2013. The Consumer DSR now exceeds the Mortgage DSR as the Consumer DSR has climbed and the Mortgage DSR has continued to drop. The Mortgage DSR was near the low for the last 37 years by the third quarter of 2017. 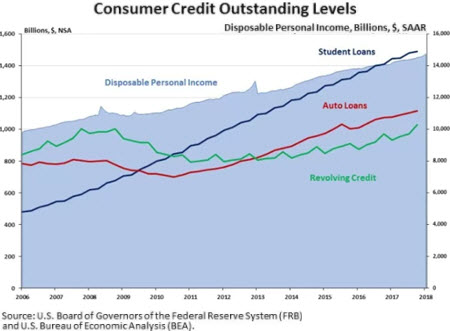 Figure 3 The Consumer DSR assesses payments on household debt, not secured by real estate, relative to income. Figure 3 compares total outstanding debt and aggregate disposable income to identify the possible sources of recent growth in the Consumer DSR. Analysis of this data suggests that the three major categories of consumer credit have risen faster than income since 2013, with student and auto loans leading the way. The increase in the Consumer DSR reflected an increase in consumer credit outstanding. While disposable personal income has risen since 2013, consumer credit has grown faster. Since 2013, disposable personal income rose by 19% and consumer credit expanded by 32%. Figure 3 shows the trend of three different types of consumer credit outstanding along with disposable personal income from 2006 to the present. The three types of consumer credit outstanding include student loans, auto loans, and revolving credit, which are largely composed of credit card debt. Between 2007 and 2012, student loans have increased by 94%, much faster than the 23% growth rate of disposable personal income. Meanwhile, auto loan debt outstanding has expanded at a slower rate of 4%, and revolving credit outstanding declined by 5% during the same period. Due to the slow increase in auto loan debt outstanding and decline in revolving credit outstanding, consumer credit rose by 20% over this period. Since 2013, student loan debt has increased by 37%, faster than the 19% growth rate in disposable personal income. At 36%, auto loan debt has matched the growth in student loan, also rising faster than income since 2013. Meanwhile, revolving credit growth since 2013 has expanded by 28%. This analysis of aggregate values as opposed to monthly payments suggests that growth in student loan debt has exceeded income growth at least since 2007. However, between 2007 and 2012, income growth exceeded the increase in auto loans and credit card debt, causing the Consumer DSR to fall, paralleling the decline in the Mortgage DSR. Since 2012, student loan debt has continue to rise faster than income, but now both auto and revolving debt are growing at rates faster than income as well. As a result, the Consumer DSR has risen even as the Mortgage DSR continues to fall. However, despite the increase, the Consumer DSR remains below the peak recorded in 2001. Original Source: National Association of Home Builders |
|
||||||||||||||||||||||||||


| |
||||||||||||||||||||||||||||||||||||||||||||||||||||||||||||||||||||||||||||||||||||||
|
||||||||||||||||||||||||||||||||||||||||||||||||||||||||||||||||||||||||||||||||||||||

|
||||||||||||||||||||