|
|||||||||||||||||||||||||||
| HOUSING: GOING FROM GOOD TO GREAT By William Mack, CFA Not Your Father's Housing Cycle Activity levels and selling prices for the domestic real estate market last peaked in 2005, two years after the prior peak of the economic cycle (i.e., GDP) in 2003 (at 4.4%). Thus, by preceding the 2008-09 recession, this most recent national housing bust set a precedent as the first in recorded history in which housing helped lead the economy down. And when economic activity bottomed in early-'09 (March GDP fell 4.9%), domestic housing remained at stubbornly low levels for a few more years. 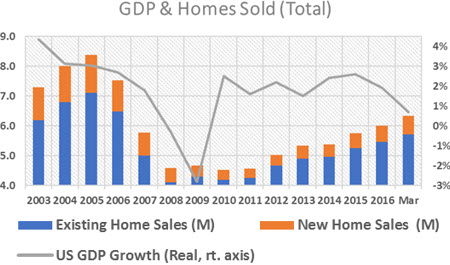 Sources: US Dept. of Labor, National Association of Realtors (NAR), US Bureau of Census. Note: sales of existing homes account for >90% of all homes sold in the US, up from ~85% pre-crisis. Even today, more than a decade after the start of housing's precipitous decline, total US sales volumes (including new homes) remain nearly 30% below peak levels, and over 15% below the 2000-'05 average. It is a different world post-crisis / housing bust, and residential real estate's demographic hurdles remain high. For example, baby boomers, many of whom live on fixed income payments, are only beginning to downsize or move into managed care facilities. The more pervasive demographic challenge to home-ownership rates - now below 64%, vs. more than 69% in 2004 - is posed by 'echo boomers', in their 20's and 30's. Born in the 80's and 90's these younger demo's that nevertheless still account for the bulk of entry-level home purchases, more often favor renting over buying, a contrast to their parents and grandparents. Thus, entry-level home-buying now represents only about one-third of housing activity, down solidly from pre-crisis historical levels averaging 40%. First-time buying has, however, slowly improved from cycle lows in the high 20%'s, and in my opinion has plenty of runway ahead. 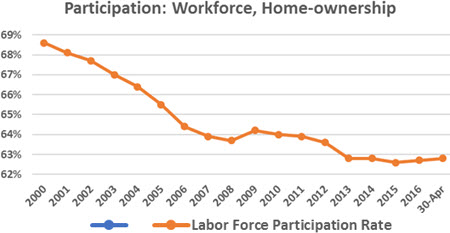 Source: US Dept. of Labor A couple quick observations. The tight relationship between labor force participation and home-ownership, both of which appear to be bottoming or at least steadying. And, more importantly, the nearly six percentage point drop in home-ownership since 2004, and the comparable decline in entry level home purchases from most past averages. This paucity of first-time purchases, of relatively inexpensive homes, in fact overstates housing's recent strength and helps underscore the housing industry's lack of breadth. Case-Shiller, a commonly used barometer of domestic house prices (only), echoes later price charts, and indicates average selling prices (ASP's) are still below levels more than 10 years ago. 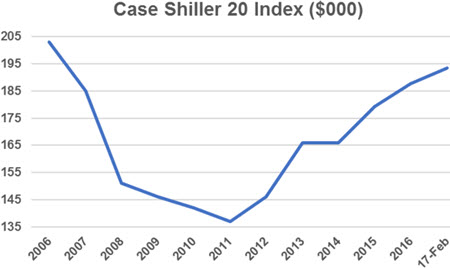 Source: S&P Corelogic Case-Shiller. It's About Jobs (Mainly) The most important driver for housing demand is job growth. Moreover, it's the absolute number of jobs created, rather than the unemployment rate, upon which housing most depends. 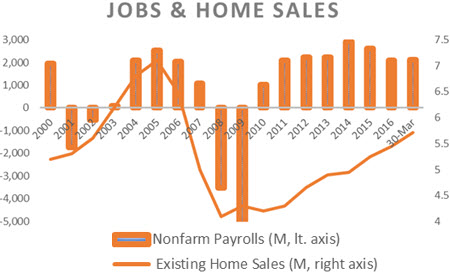 The 2017 YTD figure is annualized, and based on latest figures: April's jobs and March's home sales. Sources: US Dept. of Labor, NAR. Indeed, existing home sales have tracked changes in jobs, but in direction - rather than in magnitude. Since housing peaked in late-2005, the US economy has added roughly 11 million new jobs, yet housing activity remains solidly below past levels, as we'll talk more about. At some point new jobs will more accurately translate into similar increases in home sales. Confidence Is Key Consumer confidence is the next most important driver of home sales, after employment. Multiple cycles of empirical data bear this out. 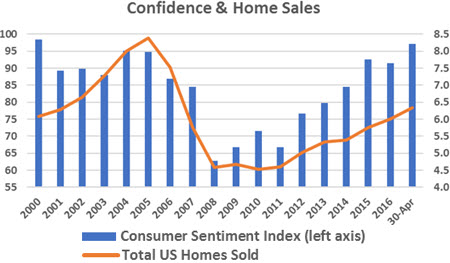 Consumer sentiment based on annual averages of month-end figures Sources: University of Michigan, US Dept. of Labor, NAR Despite steady improvements in consumer confidence since its 2008 trough, the figure, though still steadily upward trending, remains below it base level (100) just as home sales volumes track below their 'normalized' levels. To paraphrase Jamie Dimon, CEO of JP Morgan Chase, the country's #2 mortgage originator (after Wells Fargo), consumer confidence is the 'secret sauce', to housing. Interest Rates Matter, Though Less Than Is Assumed Of course rates matter for housing: a single percentage point decline in mortgage rates buys a 15% more house (over 30 years, ceteris paribus). But, contrary to conventional beliefs, empirical evidence suggests interest rates rank behind consumer confidence in terms of importance for the industry. Although it's the third leg of the proverbial stool supporting home sales, (mortgage) rates are the factor that most directly benefit from a Federal Reserve Board that has been decidedly 'dovish', pursuing relatively easy monetary policy these past 35 years or so. 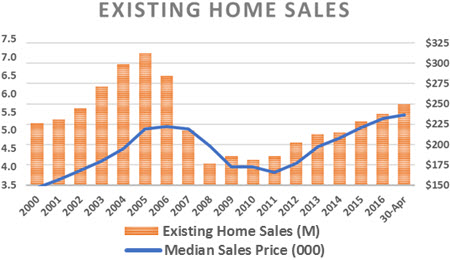 Source: NAR Yet as investors (and borrowers) handicap a potential increase in short-term rates by the central bank in its next (NYSEARCA:JUNE) meeting, we tend to overstate the impact of mortgage rates on housing. Favorable borrowing rates had a mitigating effect on the housing 'bust'. The Fed's move to zero short-term rates, which lasted a full seven-years (Dec. '08 - Dec. '15) has thus far had a similarly benign impact on the subsequent recovery. Their impact (low rates) has been partly muted by a number of factors, mainly mortgage originators' basic business decisions (i.e., risk / reward), stricter home-lending regulations, the disappearance of independent mortgage brokers (e.g., Washington Mutual, Countrywide, etc.) and the reduced activity among government sponsored mortgage securitizers (e.g, Fannie Mae). Yet were it not for mortgage rates following 10-year Treasurys to just over 2% with the launch of quantitative easing (late-2008), financial history might have been much different: One can only speculate on the further damage to home prices, mortgages (especially adjustable), securitizations, etc. that would have occurred had the Federal Reserve not stepped in with zero rates and levered its balance sheet by $4 trillion. Housing To Catch-Up To Other Asset Classes Since 2000, which encompasses not one - but two - historically long economic (up) cycles - the median sales prices for existing homes have risen just 3% a year compounded (from $147k in 2000 to $236k in March 2017). 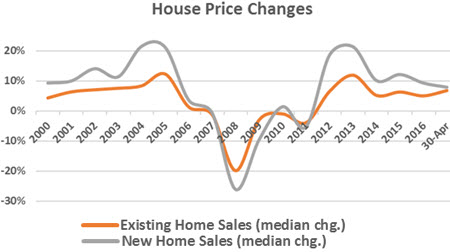 Sources: US Bureau of Census, NAR And yet over this same span, these tepid gains in home prices equal only about half the returns for stocks (the S&P 500) - marked from near their previous highs. Yet unlike a home that is typically leveraged three- or four-to-one, the stock market (and the companies included) sees little, if any direct benefit from leverage. The chart below indicates a weak relationship between falling long-term rates and home sales volumes but a pretty strong correlation with stock market returns. 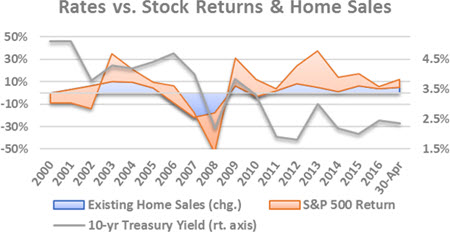 Source: NAR A few words on housing returns vs. bond returns (not included in the chart above). It's understood that the 10-year US Treasury Bond is the reference rate for 30-year mortgages, given similar durations of seven to nine-years. But based on yields alone, this risk-free, zero collateral instrument has kept pace with these (c. 3%) annual home price gains. Moreover, the price appreciation in 10-year Treasurys that accompanies the halving in yields over the comparison period (from 2000) adds another percentage point a year to its return. Scarce Dirt? The following chart details US new home permit and construction data, helps to magnify the slow, but steady, recovery in home sales activity. 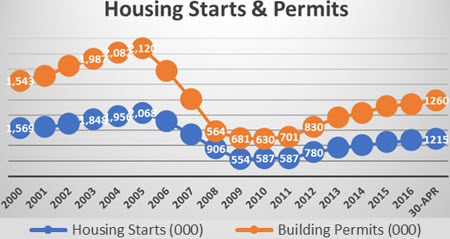 Source: US Bureau of Census. Much of the blame for housing's slow recovery is lack of supply, or housing stock, including new home construction. But this characterization is mostly unwarranted, since no single part of the 'housing complex' operates in a vacuum - from buyers, to originators, to government sanctioned securitizers, to ratings agencies. And let's not leave out the Wall Street investment banks (in case you haven't seen The Big Short). Thus lack of supply is at most a symptom, rather than the cause of a still relatively muted housing market. A potential buyer is no more likely to take a 30-year mortgage if he's insecure about his job than the lender who just wants to be repaid - with interest and amid a flat yield curve (which helps determine the lender's net interest margin, or return). In fact, the reasons for a slow recovery are nearly infinite. But thankfully, given enough time, markets tend to get it right. Warren Buffett's adage about the stock market being a beauty contest in the short run can be applied to the housing market - itself a long-cycle industry. As Buffett says, the stock…er..housing market is a weighing machine in the long run. On this basis, most key housing-related measurables, in addition to those already discussed, are moving in its favor. Since housing peaked a dozen years ago consider: The US has added 13 million new households (up 11% since late-2005) The overall population has grown by 30 million (up 10%) The labor force is larger by 10 million (up 7%) 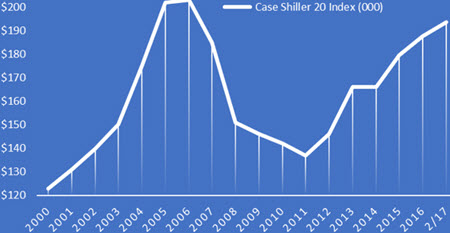 Source: US Dept. of Labor So ... Buy Builder Stocks Buying the stocks of big builders is the best pure-play on US housing, as the group's operational performance continues to benefit from the broader recovery. The availability of funding relatively risky, capital intensive property development smaller peers face hinted at earlier is in fact the key advantage among large publicly traded homebuilders. 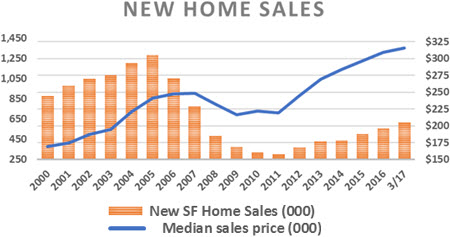 Source: US Bureau of Census This access to capital has allowed the country's largest builders to consolidate market share and grow faster than their smaller, capital constrained peers. Indeed, the top nine production builders have increased their share of the US new home market to more than one-fourth from just over a fifth since the crisis. 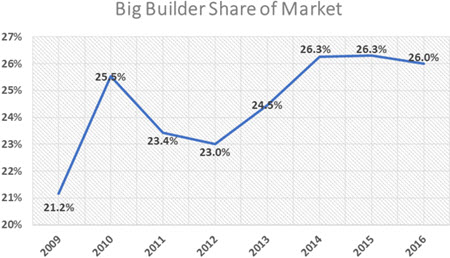 Source: Company SEC filings (10-Ks), US Bureau of Census Market share gains have bolstered the pricing power of these market leaders. 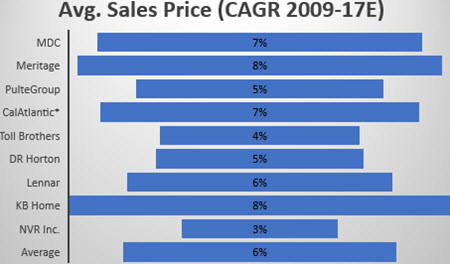 Source: Company SEC filings (10-Ks) *CalAtlantic is pro-forma for the merger of Ryland and Standard Pacific. The main purpose of this article is to highlight strength in the economically important US housing market. Summarizing the group's valuation and growth profile: 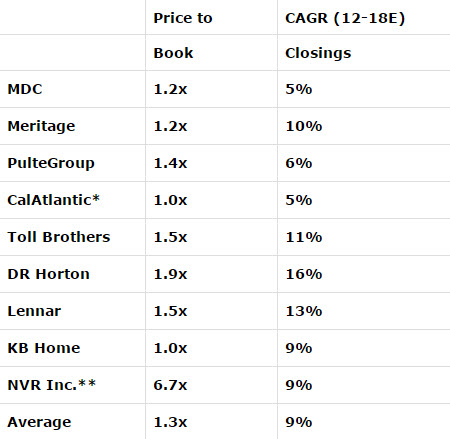 Source: Company SEC filings (10-Ks) *CalAtlantic is pro-forma for the merger of Ryland and Standard Pacific. **NVR is excluded from the group's average price to book value. There are few industries (outside tobacco) with the pricing power of homebuilders. And, is there another US industry with 9% annual unit growth ('closings' above), 6% yearly price increases and valued at just 30% above book? D.R. Horton is both the fastest growing and largest homebuilder, a rare combination and a key to our argument for buying the stock in fall 2014. And even though today's valuation, (1.9 times stockholder's equity), has risen since then (to the group average), its relatively strong focus on first-time buying segment is a fundamental driver of its growth, and has only begun to play out. William Mack, CFA is an analyst with a 20-plus year career split between the buy-side and the sell-side and between US and European firms. He is passionate about finding undervalued stocks. Original Source: Seeking Alpha |
  |
||||||||||||||||||||||||||


| |
||||||||||||||||||||||||||||||||||||||||||||||||||||||||||||||||||||||||||||||||||||||
|
||||||||||||||||||||||||||||||||||||||||||||||||||||||||||||||||||||||||||||||||||||||

|
||||||||||||||||||||